

Inflation is rising and the wealth gap is widening
The top 10% of U.S. earners now account for roughly half of all consumer spending
5 min read
KEY POINTS
- Nearly 60% of all consumer spending is being driven by the top 20% of earners.
- Credit card delinquencies are now at levels last seen during the Financial Crisis.
- Auto loan delinquencies remain low and stable among prime borrowers, while subprime borrowers have seen a steady upward trend of delinquencies.
The divide between the haves and the have-nots continues. That’s as April’s recently released inflation data will do little to help narrow the gap between the upper and lower halves of the national income brackets, both in terms of income and net worth.
Getting more granular, this is really a story of the widening gap between the top 10% and everyone else. According to recent data from the Federal Reserve, the top 10% of income earners in the U.S. are responsible for roughly half of all consumer spending. Expanding that to the top 20% of wage earners, 59% of all spending is being driven by this group and this disparity has been widening over the last 30 years.
To put these into perspective: In 1995, the top 20% and the bottom 80% spent roughly the same amount. This means spending was heavily weighted to the top 20% already, but since then, the top 20% have seen their share of spending increase while the bottom 80% now account for only about 41% of spending and the spread between the top 10-20% and the bottom 50% is very wide.
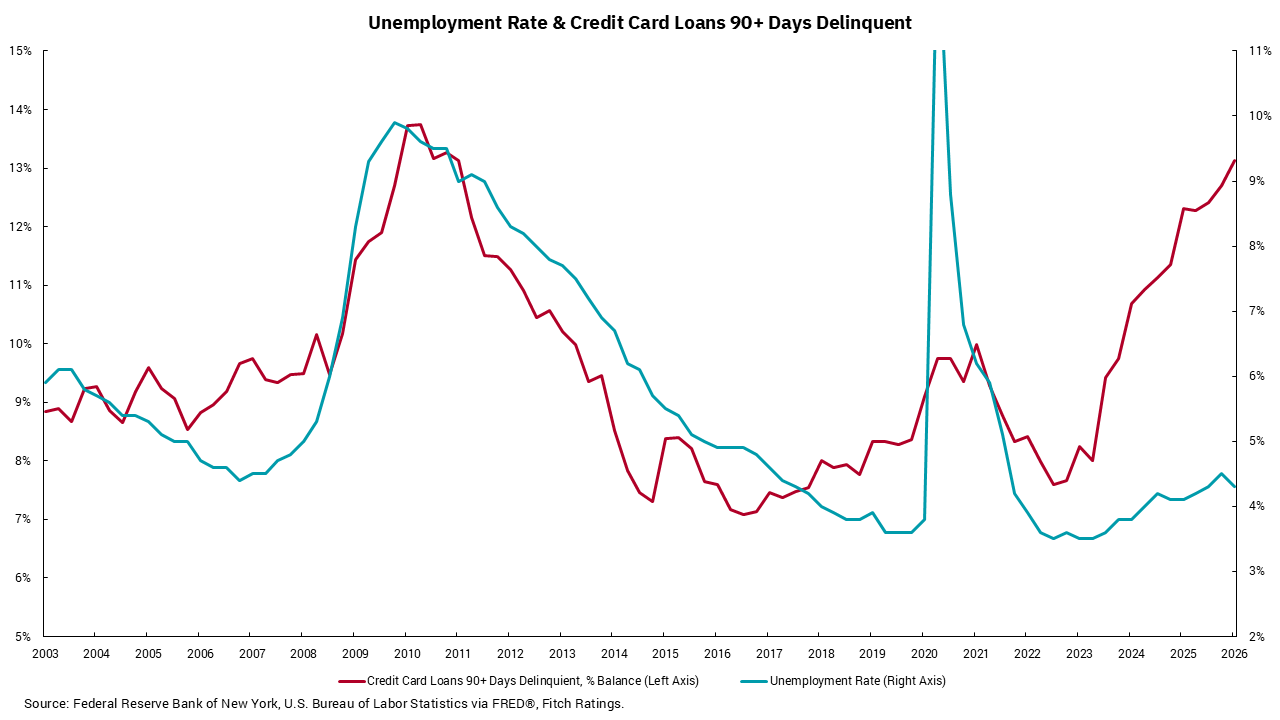
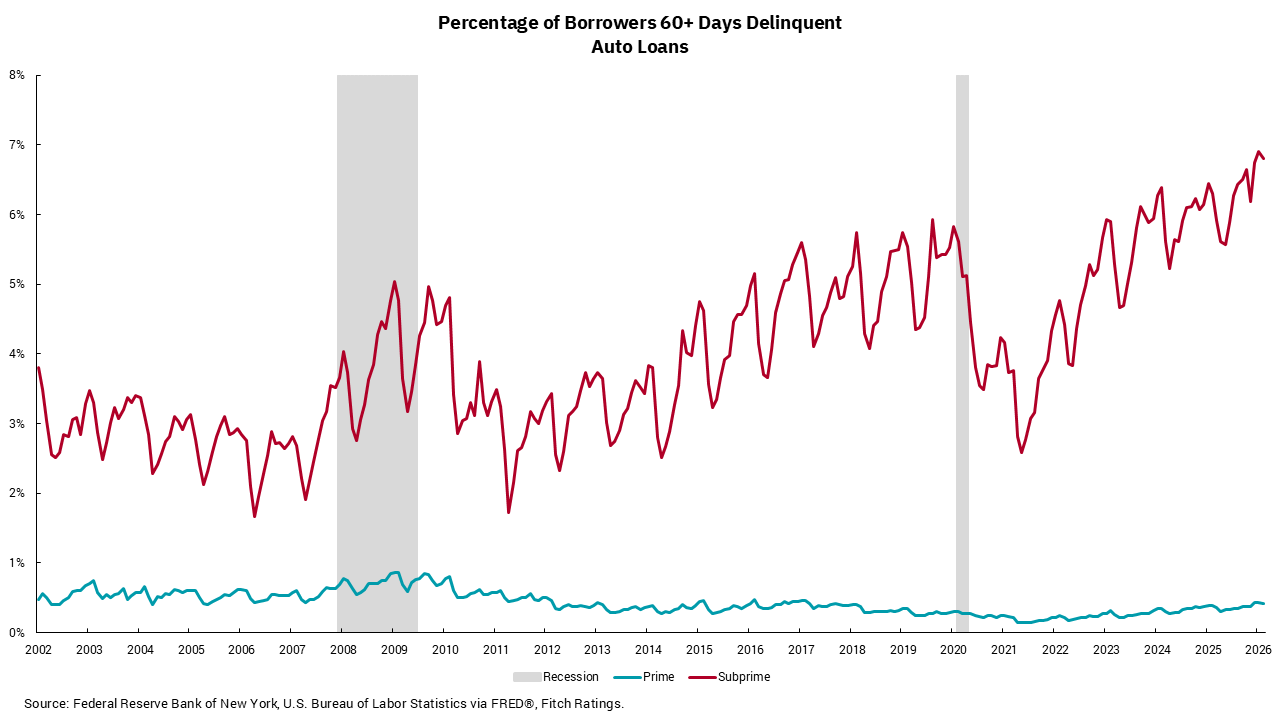
Our charts this week reveal another way this disparity is being revealed within the U.S. economy. The top chart shows 90-days-plus credit card delinquencies against the unemployment rate, and the bottom chart shows the percentage of borrowers 60+ days delinquent on auto loans, broken out by prime and subprime borrowers. Both charts show trends that indicate the impact of inflation and the widening gap between high- and low-income earners.
Until recently, the correlation between delinquencies and the unemployment rate was reasonably tight, which made sense as we know having a job is the most important aspect of overall consumer health.
Yet, over the last couple of years a clear divergence has appeared. Despite the overall unemployment rate remaining historically low, delinquencies have trended higher. This would seem to reflect the impacts of the aggregate level of inflation versus wages over the period coming out of the pandemic. In short, aggregate inflation has exceeded aggregate wage gains over this period leading to lower-income consumers leaning more heavily on credit card debt to make ends meet. We would note credit card delinquencies are now at levels last seen during the Financial Crisis when unemployment rates were materially higher.
The bottom chart shows another perspective on this issue. Prime borrowers have seen auto delinquencies remain low and stable while subprime borrowers have seen a steady upward trend and are now at levels which exceed past periods of economic stress. Higher car prices are an important part of this equation as borrowers have had to take on more debt just to have a means of transportation while higher interest rates have made the average car loan payment a much larger part of consumer budgets. Both charts show why getting inflation down is, and should continue to be, a key goal for the Fed. Inflation is an insidious tax which hurts those who can least afford it the most. The Iran conflict is going to complicate this process for the next few months but should not alter the longer-term goal of lower inflation.
Get By the Numbers delivered to your inbox.
Subscribe (Opens in a new tab)